Project 3 – Google Data

Some context to the landscape 

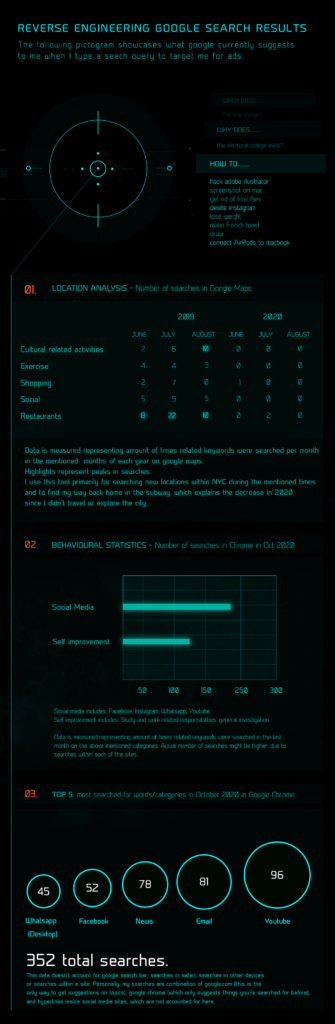
The fist pictogram has a list to the right that showcases what google currently suggests for me as automated fill out when I type a search query, for example when I start typing  ‘How to’ or ‘Why do’ and it attempts to fill in the rest of the sentence. This is different for every person, but my intention with showing this is to start with what google already knows about me and is suggesting I should want to find, and then try to reverse engineer how they got there based on available data (not all of it is available) to get a general idea of how I’m being profiled. Unsurprisingly, all the things that are suggested at present have to do with topics currently going on in my life some of which are highlighted on Pictogram 1, and not all of which I searched for directly in google. Some of these are even things like my mother getting a new dog, mi intention to quit social media addiction, recent acquisition of electronics, etc.
The data sets I’m using are from both google chrome extension (which also harnesses your data even if you’re using a search engine that isn’t google) and the google maps data set. 
My past study was related to the same subject, only it was using my youtube data so my intention is also to expand on how I’m spending my time on these platforms as well.
I realize the question is a bit ambitious since I’m only a beginner, and the people in this space are entire teams of sophisticated engineers, however, some interesting insights might surface along the way.

Audience

My audience could be divided into 2 categories: The more apt audience to criticize and give feedback to my work are engineering professionals or data savvy analysts that can better guide me through my learning curve as I am still learning the language of data and programing. They might find the question relevant or interesting as a challenge to try and solve themselves and find holes in this work.

On the other hand we have people like myself who just have general understanding of data, but who have an interest in disclosing the procedures Google has deployed for profiling us and what might actually be involved in that process.

Hypothesis/Assumptions

1.I would expect a long list of predetermined FAQ’s that contains  keywords relating to my question, specially since as the words change
2.I expect seasonal questions, or time sensitive variations to be on top of the list. Ex: How cold is the weather tomorrow? would be on top.
3.Pattern recognition of my behavior: They probably know if I have repetitive behavior so they suggest it for me before I even search for it. Ex:Searching the same song over and over.
4.Actual number of views of news may vary, since sometimes I’m looking at them either on the phone or on facebook
5.They use my IP address to connect with credit cards purchases (Yes they store that too with Google Pay) and see if I purchased a new set of headphones, then they suggest how to connect them to my computer in the search bar.
6.Text analysis might be so advanced now that Google might even recognize the intent of making a question, and help clarify what you want. 
7.Some of these suggestions in the search bar might be intended to provoke curiosity, to keep the user on longer than usual.

Google Maps Data

I’ve had a dramatic decrease in spatial searches from 2019 to 2020 according to data from google maps, which makes sense since I’ve traveled less, gone out less, eaten out less due to the COVID pandemic. Most searches in 2019 related to restaurants during the summer time, and also cultural activities. 2020 data is almost non-existent.

Google Chrome Data

Although It’s not possible to get a full picture of the google search bar suggestions from just the chrome extension data, and given that the topics I’ve searched are so varied, I classified everything into 2 different categories: Self improvement and Social media which is my biggest consumption ( I’m a bit embarrassed to admit this). I also used just the last month since I don’t yet have the skills to classify entire years worth of data.
I’m starting a master’s degree and lot of my searches have to do with email, tuition, student loans, registration, learning so I classified all that into self improvement.
From a personal standpoint, the amount of  increase in social media consumption may be equal to the amount of time spent outside before the pandemic, and although this claim isn’t based on data, it’s probably been my response to the lack  of social interaction, since I didn’t consume that much before.

Conclusions and next steps

It’s difficult to try and figure out how an algorithm that has many years in the making, that is proprietary and that uses a lot of data in different ways actually works for a small work like this one. I wasn’t able to find any data conclusive as to how they knew I wanted to delete my social media accounts, how they knew dogs might be a relevant subject in my life recently, etc. Since none of that input was typed into chrome. 
Doing text analysis or word bubbles might be a next step, or having coding abilities and automating text analysis to figure out what was that secure would be my best bet.

My social media consumption has gone way up in the past year, and the mechanisms behind that addiction are still a mystery to me.

Project 2 – Quantified Self

Question
With the increasing amount of time and attention we spend on our devices it’s important to discover how these are being allocated, what suggestions in the apps trigger our focus to stay more and more on these platforms and whether the companies that monetize this attention know more about us than we know about ourselves with regards to our motivations, as well as how much time we end up spending vs how much we intended to spend. The question becomes if the data can help educate ourselves and possibly to determine what course of action to take with regards to habits and the impact this is having on our psyche, since we know these companies don’t have our well-being as their primary focus.

Data is measured using last week of each month from August 2020 to October 2020.
Numbers represent total views per week
Data is measured using last week of each month from August 2020 to October 2020.
Numbers represent total views per week

How much am I being influenced to stay?
According to computer scientist and ethicist Tristan Harris (link below) 70% of our consumption in youtube videos comes from the recommendations youtube gives. This could be a more optimized attention, in what would otherwise be a waste of time looking at irrelevant topics given a particular taste, were it not for the fact that it also ends up reinforcing a particular behavior or view, regardless of consequence for the sake of profit.

Data is measured using last week of each month from August 2020 to October 2020.
Numbers represent total views per week

Using as a sample an average week in september on the most viewed subjects,
and comparing the data sets of what I searched for vs how much I ended up looking at, hints at patterns to what makes me keep watching; I watch a lot of the suggestions that appear on the home page once I sign into Youtube, which does’t even require a search to start the video, which would explain why the meditation view bar is bigger than the search bar. Since a lot of my consumption is for music, workouts or meditation for which I use a lot of the same videos, for these I have playlists which don’t require search.

But this algorithm also considers thousands of data points to make decisions I don’t have access to: How long did I stay in the video I was recommended, did I look at it for a bit and then switch? Does it know what times of the day to suggest certain things? Did I stop watching it but return 5 minutes later? All these are factors that supercomputers take into account.
An interesting find is that even though “Tutorials” has a higher rate of what I searched for vs what I actually ended up looking at, points towards the fact that often when looking for tutorials I tend to look for something specific and non generic, which would enlarge the number of searches without increasing the number of views and probably therefore of recommendations , but the fact still remains that the effectiveness of the search is still way better than if we compared it to a non-assisted tutorial search. We also don’t know to what extent which topic in my search history is me being already biased by the suggestions to look them up, as these phenomena, as I said before, reinforce behavior.

One of the ways in which I would like to expand this project, was that I found that a lot of the videos in the recommendations, and are probably videos I’ll just watch once, and make up a vast percentage of the total views, for example, interviews with people from topics I’ve looked for, entertainment facts about the topics I like, so I would like to see whether or not these suggestions vary form person to person, since not all these suggestions i get are necessarily the most viewed by most people.

Data is measured using last week of each month from August 2020 to October 2020.
Numbers represent total views per week

Conclusion- Final thoughts

Recent documentaries like “The Social Dilemma”  in which previous members of these companies expose the engineering behind capturing our attention and the impact this has had on the human psyche (specially teenagers), the continuing debate on the spread of misinformation, and increasingly complex legislation regarding data privacy, the ad revenue model, among other topics that generate controversy shed a bad light on this.

However a lot of small businesses and entrepreneurs have flourished with minimal resources, like was never possible before, using targeted advertising at a fraction of the cost of what a billboard would cost, at a much higher rate of effectiveness.

Specially during these times of pandemic these resources have proven vital for society in the need to reinvent the advertising businesses need to survive.

A useful Sam Harris podcast surrounding this topic

– WELCOME TO THE CULT FACTORY A Conversation with Tristan Harris
https://www.youtube.com/watch?v=1se6POdUcWM&t=1253s&ab_channel=SamHarris

Noise Study – 311 Data by Ernesto Furchtgott

Sound and silence

I’ve always been annoyed by loud music, specially people unconcerned with neighborhood etiquette. I live in Harlem and constantly have to be reminded of this fact, it’d be great if we could improve police action so we can all have more tranquility or better yet improve cultural values that make this facet of civic behavior constantly improve in our lives.  


Anyone who has researched the effects of sound on the body, the nervous system, blood pressure, mental health, will know there is something to be said about the relationship between noise pollution and general well being.

There is a reason hip hop, bachata or heavy metal are banned in hospitals, since they don’t promote restorative qualities, nor are they beneficial to the state of mind of a suffering person. One need only go to nature, and experience its curative faculties, its silence and harmony of sounds to see the effects these 2 very different wavelengths have on the body.

Plants have also been known to respond positively, grow richer, healthier, stronger, when exposed to classical music, jazz, Native American flutes, or other kinds of cultural music that have harmony. There is also research that supports these types of music as beneficial to the cerebral development on babies, and in music therapy which is an evidence-based clinical use of musical interventions to improve clients’ quality of life.

It’s hard for people to realize the immediate effect a noisy environment. But just as our visual world can be polluted, like Times Square, or our natural environment can be polluted and these have consequences to our lives, our auditory world can have these cluttered and unhealthy characteristics as well. 

Sound is a very peculiar phenomenon, as it has even in a dentist setting, an ability to sterilize instruments by pulverizing bacteria with waves.  

Research Question

Can the data reveal a pattern of repetitive but preventable noise activity in a particular zone or time, excluding patterns like garbage trucks which are unavoidable, and can these places be policed regularly to reduce noise pollution? Or can there be cultural incentives to educate people about their auditory environment?

Findings

Weekends unsurprisingly are the most noisy for residential claims.
Also unsurprisingly, the lower east side, meat-packing district, and the areas in the Upper West Side that have bars have the most residential noise claims.

I also found Brooklyn is the noisiest neighborhood for residential  and commercial noise, with Manhattan coming in second. 

The most common type of noise is coming from loud music and parties, especially growing in 2020, probably due to COVID-19 and people partying in their houses instead of bars, and also people being in their homes during work makes then more susceptible to noise and more likely to file a claim.

During the past 3 years, before COVID, the noisiest months were June, September and May.

Audience

Institutions who could take action on this study
-Police 

Individuals who are affected by this study
-Recovering hospital on in-house patients
-Parents with newborns
-People’s general well-being 

Conclusions and questions

-Predicting noise hotspots for police might save gas and human resources, 311 might reduce the volume of calls, therefor reducing resources and tax money spent responding and reducing the amount of noise.

Next steps
– Using the insights to focus city ad campaigns into these areas.
-Reduce complaints by creating awareness to tenants before moving into the noisiest streets and neighborhoods.